Fraud detection toolkit
This page collects together the various insights used in fraud detection at SurveyEngine and follows our well received November webinar.
“Incompetents, Accomplices, or Criminals? Panel Fraud in Health Surveys.
Each method is explained with references to the various tools or citations and the webinar slides can be downloaded here:
Knowledge Base -> Data Quality -> Methods & Academic
Ben White, 08.07.2026
Why standard diagnostics miss fraud
Panel fraud in online research takes multiple forms: bots, professional survey takers who game screeners, respondents completing multiple times under different identities, and offshore panels using VPNs to appear local. In DCE studies, fraudulent responses typically manifest as straight-lining, speeding, or implausible eligibility claims.
Standard model diagnostics do not reliably detect fraud. A fraudulent straight-liner produces parameter estimates converging to zero for all attributes - indistinguishable from genuine preference indifference. A bot selecting randomly produces plausible multinomial distributions. Detection requires a multi-layered system combining survey-embedded checks, metadata analysis, and real-time monitoring.
Why fraud detection cannot wait until analysis
A 10% fraud rate does not produce a 10% bias in WTP estimates. Fraudulent responses are not random noise - straight-liners attenuate all attribute parameters toward zero; speed-completers introduce systematic patterns that differ from the genuine choice data. The bias depends on the fraud mechanism and can be large.
Early detection is the priority. Problems found at 5% fieldwork completion can be corrected. Problems found in analysis cannot. The methods above are most effective when applied in real time during fieldwork, not retrospectively.
The ten-method fraud detection toolkit
1. Realtime behavioural models
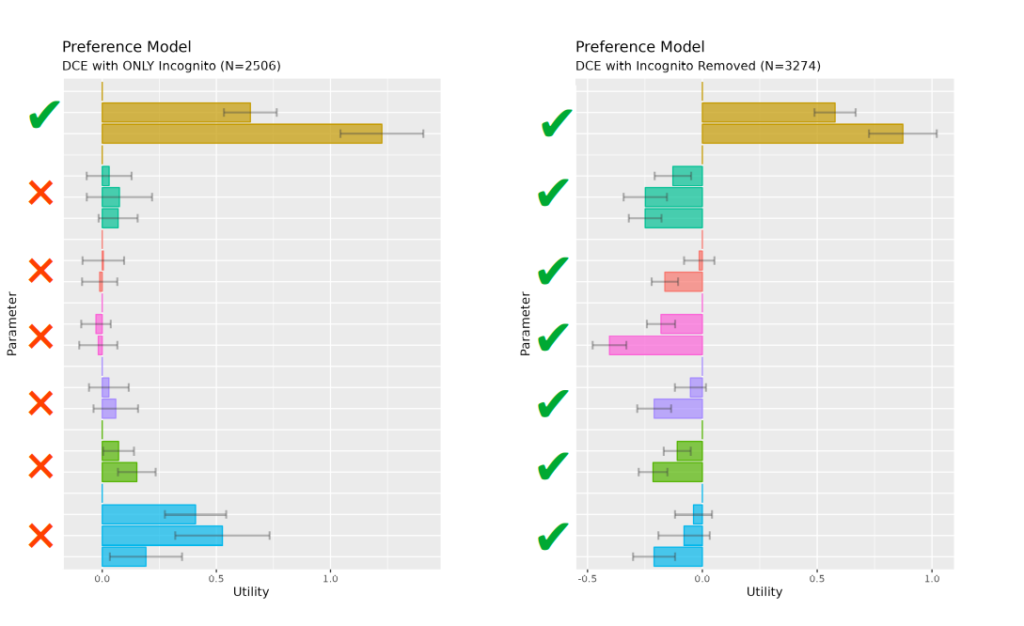
One of our principal methods to uncover fraud is the use of Irrelevant Segmentation Modelling (ISM).
Core to the method is the (reasonable) assumption that respondents' behaviour should not differ significantly by membership to a behaviorally 'irrelevant' group - such as time period, network characteristics or panel. Significant difference in such models alerts that the data contains anomalies that should be investigated further and provides reasonable justification for wholsesale removal of sub-segments - particularly when the segmentation variable may be correlated with fraud attempts.
To use this method:
- A set of defensible 'irrelevant' variables is developed that also exist in the data
- Categorise segmentation variables into minimal groups with optimal being binary groups of equal size.
- Systematically generate Joint multinomial logit (MNL) preference models generated the variables and the aggregate.
- Using a Likelihood Ratio (LR) tests with null hypothesis that no segmented models should differ statistically from the aggregate.
- Statistical significance of the LR test indicates anomalous data correlated to the segmentation variable.
- Ideally run these models in realtime for early detection and mitigation.
2. Incidence Rate check
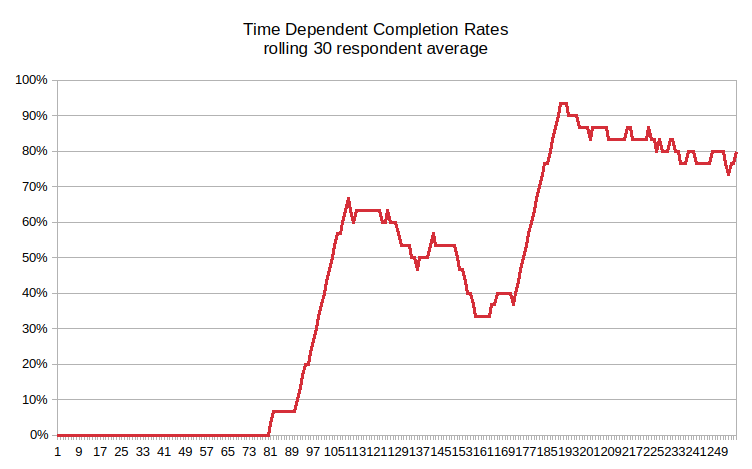
This fraud tests examines the proportion of respondents eligible, by completing in survey screening as fieldwork progresses in time.This statistic is known as incidence rate (IR).
Respondent survey trials are expected to be independent events. Results from subsequent respondents should be unrelated. The nominal probability of a respondent passing the screeners should remain at the same level throughout the survey wave - unless there are different recruitment channels, method or partners added.
A monotonic increase in IR, (overall or within periods) indicates earlier respondents are 'passing forward' knowledge on how to pass the screenout. This indicates a) direct contact with other respondents 2) a concerted effort to pass the screener. The interpretation is that this is a direct attempt to fraudulently pass the screener to maximise the incentives payments at a minimal effort by a small group.
While statistical methods can be used to categorically quantify this statistic, the method is suited to a simple visual check of increasing IR.
To use this method:
Ideally this should be done in realtime.
- Firstly estimate the expected IR from prevalence and or expected screen-out rates before starting
- Generate a rolling average of IR calculated from a meaningful statistical contiguous set, i.e above a student sample of 20.
- Chart this by entry attempt index (rather than start date) to isolate survey participation events.
- Applying some of the methods above, segment by panel, browser mode or other meta data to isolate the source or pathology
Using statistical methods - e.g. estimating slopes by quartiles or visual inspection - verify whether
a) the IR is increasing
b) the IR is at the expected level - If IR is increasing this may indicate attempted fraud.
3. Diurnal Activity check
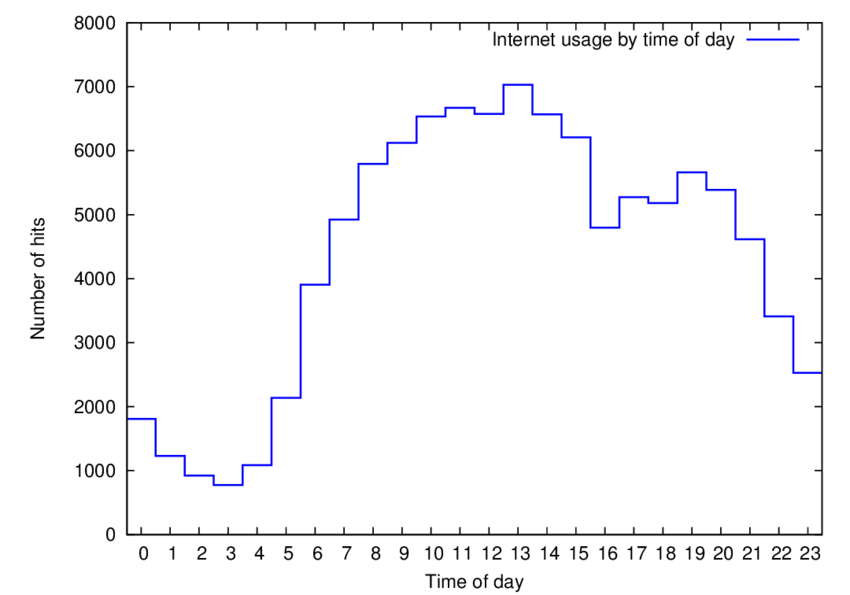
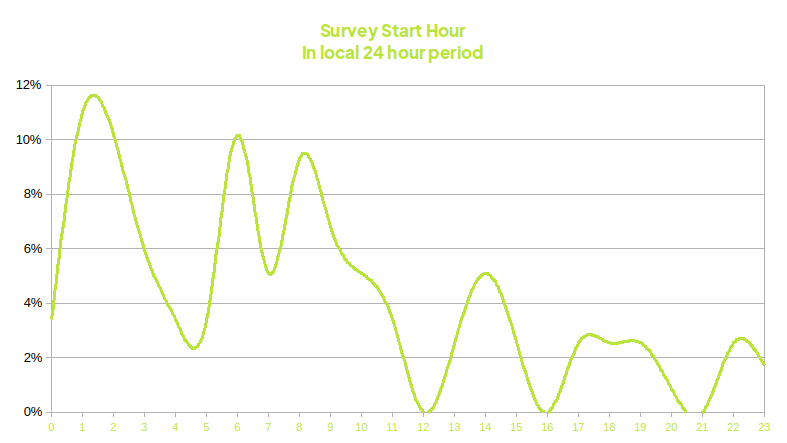
Diurnal pattern of suspected fraudulent segment
This test is more a supporting method as it charts the activity by hour of day to estimate diurnal activity.
We expect people to follow a typical diurnal pattern of activity within a survey as they would in normal online access - specifically more activity in the waking hours and less at night.
In the case that the diurnal activity within a survey differs from the expected - it may indicate that respondents are answering the survey in a different timezone. Alternately a flat activity may indicate bots as machines don't sleep.
To use this method:
- Generate counts of survey starts by 24 hour buckets in the local time over the course of data collected
- Chart the data as a histogram of the starting hour
- Segment as may be neded to isolate a specific source of fraud - such as panel or other meta data.
- Visually inspect or use a simple statistical test to compare the proportions of minimum (3am) and maximum (1pm) activity levels.
- A ratio of less than 1 to 4 may indicate a large proportion of the respondents may be in a differnt zone.
This test works best when the fraud is occurring in a different timezone to that of the expected respondents.
4. Reading speed check
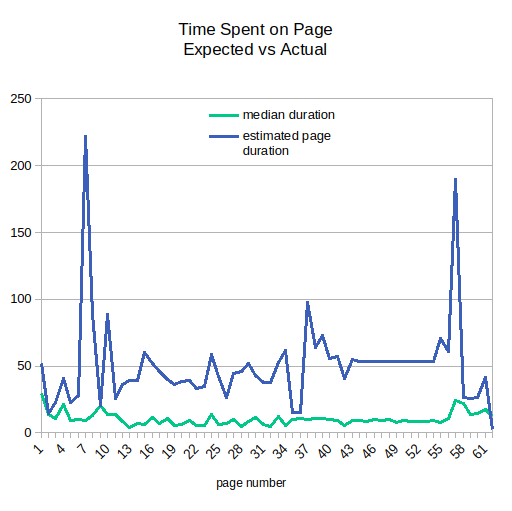
This test is a more nuanced version of the classic speeder tests. The test compares the expected time that should be spent on each survey page compared to the recorded time.
Expected time is estimated from word count and typical expected reading speed (238 word per minute).
No correlation between words on the page and time spent reading indicates inattentive respondents - which is typical of fraudsters maximising the use of their time to gain the incentive.
The test still works without an estimate of reading speed, this merely helps visualise at similar scales.
To use this method:
- Develop a word count for each page of your survey.
- Estimate the expected reading time for each page using the expected speed of your audience (e.g 238 words a minute).
- Generate the actual reading time by page using the timestamps of your survey in seconds.
- Combine the estimated reading time for each page for each respondent.
- Cross-tabulate actual vs expected for each page and chart the data.
- A simple linear regression of the actual vs expected will yield an R-squared statistic.
- A low R-Squared correlation (<0.05) indicates no relationship between textual content and time spent on the page.
This method is also a good test to determine the engagement and comprehension level of respondents.
5.VPN lookup

When accessing the internet, respondents' IP addresses usually reveal their internet provider's physical location, often in the same country as the respondent. A VPN adds another network "hop," masking their true location by routing traffic through a server, potentially in another country.
Fraudsters use VPNs to bypass location restrictions on surveys, appearing to operate locally. While VPN usage is hard to quantify, estimates suggest up to 23% use VPNs with a third doing do daily. This suggests 8% of traffic is routed this way, close to 5% in our experience.
VPN usage rates higher than 10% may indicate more respondents masking their location.
To detect VPN use, IP addresses are checked against a VPN database. We use vpnapi.io (and are unaffiliated) for reliable results. This can be done live, tagging or screening respondents for analysis.
VPN detection depends on the VPN lookup service's accuracy and coverage, with up to 80% detected. Some fraudsters create short-lived, private VPNs for one-off scams, which are nearly impossible to catch.
To use this method (in realtime)
- Select a VPN lookup provider. We use vpnapi.io.
- Read the docs on integrating the api calls. for vpnapi.io the docs can be found here.
- Add a javascript block to your survey data collection form - something like this.
 var ipAddress = /* get your IP address through your own survey system*/
  fetch(`https://vpnapi.io/api/${ipAddress}?key=<your API key>`)  /* perform the API request using your key
    .then(data =>    { /* place the value of data.security.vpn into your survey data collection system
   })
    .catch(err =>    {alert("error calling vpnio") /* or some other error handler})
Then use your survey system to record or screen out based on VPN usage.
6. Browser mode check
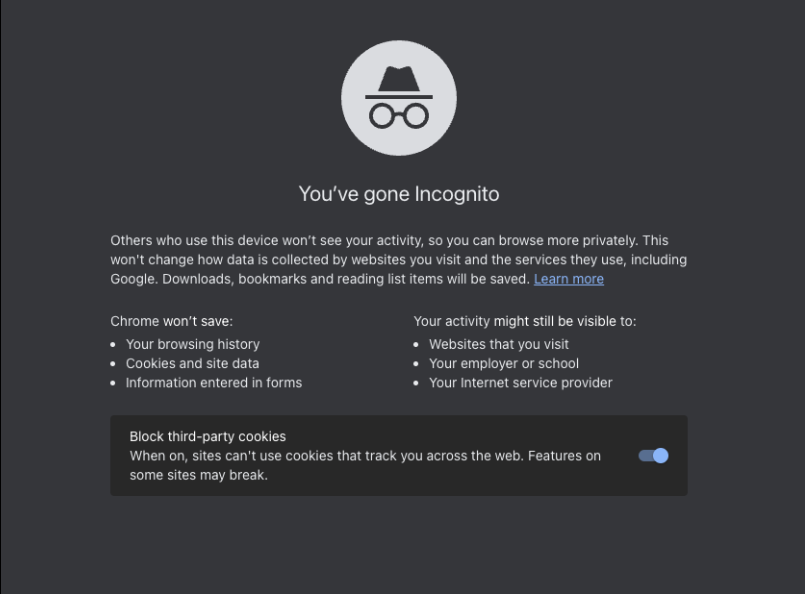
Another layer to checking for suspicious browser activity is to detect if respondents are accessing the survey in 'private mode'. Fraudsters may use this mode to facilitate automatic clearing of cookies and hide their plug-in profile so they can attempt the survey multiple time.
https://github.com/fingerprintjs/cdn
To use this method (in realtime)
Implementation is virtually the same as above - a call is made to an API and the data transferred to your survey system.
Choose your code base - e.g. fingerprintjs (link above)
7. Fingerprinting

Various third party options attempt to uniquely identify respondents without cookies. This is done by capturing hundreds of local meta datum such as browser, screen resolution language settings etc. to be able to uniquely identify a single machine. This is useful for detecting multiple attempts by fraudsters.
To use this method
This is provided as additional data by the same library as above https://github.com/fingerprintjs/cdn
8. Domain specific literacy questions

domain specific questions are included within the survey and designed to have answers that typically on only a valid respondent should know. These questions aim to ensure the respondent is genuinely a part of the target population.
These questions also ensure that participants have sufficient knowledge of the topic to provide meaningful responses, especially in surveys or studies that require expertise or informed opinions.
For example, for a study on HIV treatments, you could include treatment specific questions such as:
What antiretroviral therapy are you currently taking?
How has your diagnosis affected your mental health?
Have you gotten access to mental health support services?
To use this method
- Questions need to be developed by the researcher that indicate the likely level of comprehension of the survey subject matter.
- The Questions are implemented - typically up front
- If possible Respondents are detected and screened out before participating further in the study.
- Alternately post processing may reveal supporting evidence as to likely fraudulent respondents.
These questions do require the researcher to have a deep understanding of both the sample frame and it's complement. They are therefore more of an art than a science.
9. Trap questions

A trap question in an online survey is a type of question designed to assess whether respondents are paying attention and providing thoughtful answers rather than randomly or carelessly clicking through. These questions help identify inattentive or low-quality respondents, ensuring the reliability of survey data. Trap questions should be objective to avoid biases.
Here are a few examples:
The sky is green, how much do you agree? (select 1-4)
If you are paying attention, select 3 from the scale below
To verify that you are paying attention, please select “Very dissatisfied” to this question, regardless of how you feel.
To use this method
- Questions need to be developed to trap the inattentive. Unlike Literacy questions these can be generic as in the examples above.
Alternately post processing may reveal supporting evidence as to likely fraudulent respondents.
The Questions are implemented - typically up front
If possible respondents are detected and screened out before participating further in the study.
10. Captchas
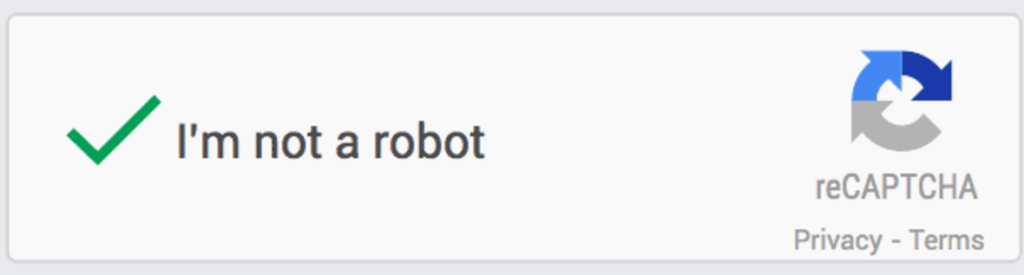
A CAPTCHA is a type of security measure known as challenge-response authentication. CAPTCHAs are a general soilution to the problem of automated form filling bots. They do this by requiring the respondent to perform a test that is difficult for a bot but relatively easy for a human. Often the task is a red herring, such as clicking a 'I'm not a robot' button, in order to track mouse movement and compare the 'human-ness' of the mouse path.
They can also be visual tests such as re-typing in distorted letters and numbers.
To use this method.
Review the docs at the relevant CAPTCH provider e.g. https://www.google.com/recaptcha/about/
Typically this is a simple paste of some HTML code within your survey.
Case: Health preference study fraud detection
A health preference study targeting NM-CRPC patients shows an incidence rate rising from 8% to 34% over three days. Metadata analysis reveals 71% of high-IR completions originate from the same panel sub-network. Diurnal analysis shows a flat overnight completion pattern inconsistent with the target timezone.
Real-time behavioural models using irrelevant segmentation variables confirm statistically significant preference differences between the high-IR sub-network and the remainder of the sample. The sub-network is excluded. Fieldwork resumes with an IR of 11% - consistent with the initial rate and the expected prevalence from the clinical literature.
References
Contact SurveyEngine to discuss fraud detection strategies for your study.
Or Contact us at support@surveyengine.com — we're glad to help.