Best – Worst Experiment Tutorial
Best – Worst Experiment Tutorial
What a Best-Worst Experiment is and How to set one up.
Quick Start
What is a Best Worst Experiment
… and why use it
Best worst solves a common market research problem: how to prioritise a list of question items from a respondent.
For example, you may be a product manager wanting to prioritise development planning, or a marketer wanting to know which are your best features. You may even be a researcher wanting to reduce your attribute set.
In short, Best-Worst is:
- A formal method for measuring the importance of large lists of features.
- Easier on the respondent than rating, ranking or constant sum questions.
- Designed by breaking down large lists of features to bite -sized questions of 3 or 4 options at a time.
- Largely bias free.
- Able to produce ‘Importance’ measures rather than just rank order.
- Easy to implement with little setup.
- Also known as ‘MaxDiff’.
Best-Worst is a good starting point for those new to econometric analysis.
What does it look like to the Respondent?
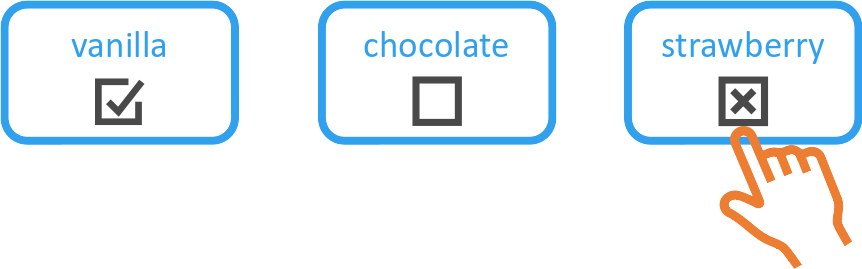
A best-worst task is simple and natural for a respondent. They are only asked to choose the best option and then the worst option.
Respondent chooses Best :
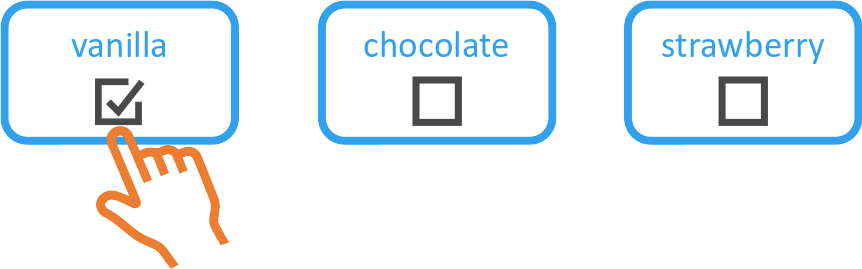
Then the respondent chooses Worst :
The Main Components of Best-Worst
1. A list of Items
This is the feed-in to the experiment, typically these are short phrases or sentences which may describe a feature, topic or a block of text. 10 to 30 items no longer than a phrase are common.
2. A Task structure
Typically respondents choose the best and then the worst from 3 items.

This yields the following Implied rank orderings:
A > B (vanilla is better than chocolate)
A > C (vanilla is better than strawberry)
B > C (chocolate is better than strawberry)
=> 3 Data points for 2 clicks.
With more alternatives the efficiency increases rapidly.
3. An Experiment Design
Your set of items needs to be broken down into sets of 3. This is the smallest set allowing a meaningful discrimination of Best and Worst.
It is important that these sets have the following properties to remove any major biases.
- Each feature is compared with each other feature an equal number of times.
- Each feature appears an equal number of times overall.
- Each feature is not compared against itself.
This design may be constructed manually, but unless you are a recreational mathematician, an algorithm is used to generate a Balanced Incomplete Block Design (BIBD) using a package such as AlgDesign or Ibd in R. Below is an example of a BIBD for 5 items (orange, apricot, lemon, apple and pear) with 3 choices.
| profile | A | B | D |
| 1 | orange | apricot | lemon |
| 2 | lemon | apple | pear |
| 3 | orange | pear | apricot |
| 4 | pear | orange | apple |
| 5 | lemon | apricot | apple |
Note that each item is compared with each other the same number of times (2) and is shown the same number of times (3) and is never compared with itself.
4. A Modelling Approach
Modelling may be done a number of ways. A simple manual analysis can be done by expanding the implied comparisons and computing a simple count of the number of times each was chosen is one way.
Alternatively a Multinomial Logit model can estimate utilities and standard errors.
Building a Best Worst Experiment in SurveyEngine
All of the above can be performed within SurveyEngine Software. For this example we’ll use a simple Case I best worst experiment on aspects of choice of a General Medical Practice.
1. Setup a Skeleton Survey
We first create a skeleton survey and leave a few empty pages for the experiment scenarios.
Dashboard->Create Survey
2. Enter Your Best Worst Items in the Experiment Editor
Navigate to the Experiment Editor using the left navigation pane.
Edit->Experiment
You’ll start with a default experiment structure. A Best-Worst is structurally a 1 attribute 3 alternative experiment, so
- Add and Alternative with the ‘+’ button on the Attribute line.
- Give the Alternatives some sensible names like ‘Option A’, ‘Option B’ and ‘Option C’.
- Delete default attributes X2 and X3.
Now enter the Best Worst Items from your list as Attribute Levels.
3. Set up the Experiment to Collect ‘Best’ and ‘Worst’
- Go to ‘Settings’ on the top right.
- Change the ‘Choices’ dropdown to ‘Best-Worst.
- Enter in sensible text for your Best and Worst options, e.g. ‘What is the MOST important?’, ‘What is the LEAST?’
4. Generate a BIBD design
- Navigate to the ‘Design’ tab.
- Select Generate ‘Orthogonal’.
SurveyEngine will create a BIBD design matching your Alternatives (3) and the number of items you have entered.
*Note if you change your number of items, you will be warned that you need to regenerate your design here.
5. Change the Layout
The Best-Worst experiment takes up only a small amount of space, so it’s worth using that space to effect and improving the functionality of the Choice task.
- Navigate to the ‘Layout’ tab.
- Change the Structure to ‘Boxed’.
- Choice mode will appear, select ‘progressive choice’.
- Change some of the layout to make the text larger and centered as you wish by selecting the ‘A’ formatting buttons.
6. Add Scenarios to your Survey
The experiment has been set up – now it’s time to place scenarios in your Survey.
Navigate back to the Survey using the navigation on the left pane.
Edit->Pages
- Add some scenario pages. 8 is typical.
- On each page add an ‘Experiment’ element. It should default to the only experiment you have made.
- Click preview to check if it all looks good.
You may also add additional instructions and questions of course.
7. Deploy and Publish
If you are happy with the preview, now is the time to deploy and collect real results.
- Navigate to Deploy->Publish.
- Click Publish.
Your survey is ready to collect data. Under the Deploy->Invitations you can create invitation links to send to your panel or via email.
8. Analysing Best Worst Data
- You can either download the data in SurveyEngine at
Results->Data. - Select the Experiment dataset from the drop-down.
OR - Navigate to Results->Models.
- Click ‘Create Model’ from the top right.
- Click Generate model in the dialog.
And your Best-Worst model will appear with Utility estimates for each item.
8. Interpreting the Model
The raw model will produce ‘Utilities’. These can be interpreted as a measure of importance. Items with higher Utilities are more preferred than ones with lower Utilities. But you can go further.
A ‘Utility’, from the MNL model, is formally the logarithm of the margin odds of choice. To convert this to probability, or more specifically the probability that one item would be chosen over another, there are some numerical transformations you can do in an Excel Spreadsheet.
Say we have the following Utility measures just for 2 items.
| Item | Utility |
| Clear Communication from GP | 1.52 |
| Telehealth and Online Consultations | -1.38 |
This means that ‘Clear Communication’ is more important than Telehealth. To turn that into something meaningful we can convert the Utilities to ‘Odds’ using the =EXP(X) function in Excel.
| Item | Utility | Odds EXP(utility) |
| Clear Communication from GP | 1.52 | 4.56 |
| Telehealth and Online Consultations | -1.38 | 0.25 |
Lets normalise the odds using the least important as the base. This is just dividing the raw odds by 0.25, the lowest value of the odds.
| Item | Utility | Odds | Normalised Odds |
| Clear Communication from GP | 1.52 | 4.56 | 18.1 |
| Telehealth and Online Consultations | -1.38 | 0.25 | 1.0 |
Now the interpretation is that ‘Clear Communication’ is preferred over 18 times as much as ‘Telehealth’. A simple further calculation can convert this in to probability.
= 18.1/ (18.1 +1)
= 95%
This means that respondents would choose ‘Clear Communication’ 95% of the time when comparing against ‘Telehealth’.
Going Further
Formally there are 3 ‘cases’ of Best-Worst. We have just demonstrated Case I. The full set are:
- Case 1 – the object case. Unstructured objects as in this example.
- Case 2 – the profile case. Essentially levels within a factor.
- Case 3 – the multi-profile case. Essentially a DCE with 3 or more options.
References and Links
- Best Worst Scaling: Theory and Methods. (paper extract). Flynn and Marley. (2014).
- Best-worst scaling: Theory, methods and applications. (book) Louviere, Flynn, & Marley (2015).
- Experimental measurement of preferences in health and healthcare using best-worst scaling: an overview. Health economics review, Mühlbacher, Kaczynski, Zweifel & Johnson, (2016)
- The rise of best-worst scaling for prioritization: A trans-disciplinary literature review. Journal of Choice Modelling. Schuster, Crossnohere, Campoamor, Hollin & Bridges (2024)
- Wikipedia Entry on Best-Worst Scaling.
- AlgDesign, an R package for generating Balanced Incomplete Block Designs.
- A Best-Worst scaling workshop by Prof Michael Burton at the University of South Australia.
Best – Worst Experiment Tutorial Read More »